All our actions, including the mere fact of breathing, have an impact on the environment. Food produce, moving around, dressing up, having a house or warming up… all these actions have an effect on our environment because we need mineral extraction, fuel consumption or land occupation to build up a house, build roads or grow crops. This impact is not necessarily bad in itself: the rest of animals and plants also have an effect on the environment, and even the impact of one species may help another survive.
Therefore, all living beings are bound to leave an ecological footprint, that is, some repercussion of our actions on the environment. However, the activity of a person living in Peru, just to set an example, has a different impact than the activity of a person living in Canada, who consumes much more in general (more food, more fuel, more water, more land, more objects, more everything). A Peruvian’s ecological footprint is not so significant.
Needless to say, some of our actions have a greater impact than others. A common example is travelling by plane, which is one of the highest energy expenses. To put it clearly, let’s see the environmental impact of a domestic flight from Barcelona to Seville in a medium-sized plane like Airbus A-320. Both airports are at 908 km distance, so a return flight would mean an emission of 0.542 tonnes of carbon dioxide into the atmosphere per passenger. This half tonne per passenger fills the volume of two double-decker buses (at a pressure of 1 atmosphere and 15ºC temperature) –quite an astonishing comparison but useless in terms of its real impact. Let’s make it easier: the impact of half tonne of carbon dioxide is the same than all the emissions of an average European person for his/her nourishment, warming up, moving around and dressing up for a couple of weeks. In the case of an American, half tonne is the amount of his/her carbon dioxide emissions in one week… but in the case of an Indian, it stands for one year. Half tonne of carbon dioxide is also the amount necessary to produce 2,350 kg of potatoes, 600 kg of bread or 50 kg of beef.
Finally, if we travel by train, the same amount of CO2 emissions would be enough to go 8 times from Barcelona to Copenhagen, which is way past Seville.
Is it really necessary to fly? Well, depending on our priorities, but anyway, we should bear in mind that our daily actions have consequences and, at least, it is our duty to be aware of them.
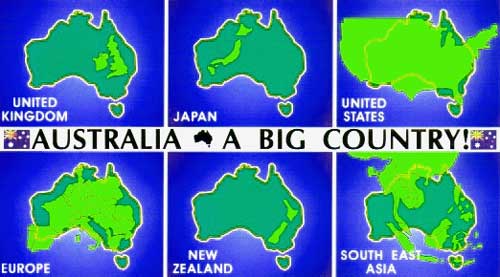
Xenophanes of Colophon, a philosopher of the Ancient Greece, used to say that if horses had to depict God, they would draw the shapes of God to look like horses. When we Europeans imagine the Earth, we also draw our own forms, and our maps depict Europe in the very middle, with a significant size. And it is often more significant than real.
Then, which is the real size of our continent? It is said that the Earth is a sphere flattened along the axis from pole to pole, but this is quite an exaggeration because the difference between the polar radius and the equatorial radius is just 21 km. Therefore, as we live in a pretty regular spherical planet, it is difficult to draw it in two dimensions on a piece of paper. Geographers and mathematicians have been long trying new forms to draw the Earth as realistically as possible, but we cannot deny the obvious: 3D objects are always somehow deformed when transferred as 2D images.
In 1974, the German film-maker Arno Peters became well-known for a new map projection, in which the areas of countries were more realistic than in the widely-used planet depiction drawn by the Flemish cartographer Gerardus Mercator 400 years ago. The UNESCO and most NGOs immediately adopted this new map because it depicts the Third World in a larger scale, so the distribution of wealth between North and South is even more unfair than what we thought. Although this new map has not become widely established, it makes us realise that the world can be represented in a different way and maybe we should change our own perception.
Let’s take a look at data. If we compare Europe with the largest countries in the world, there are six (Russia, Canada, United States, China, Brazil and Australia) which are larger than our EU27, with a total area of just 4,324,782 km2. Russia, which is the largest country in our planet, is 4 times larger than Europe. The UE could perfectly fit within the island of Australia.
There is a good exercise to better understand that our continent is not so large: just take a world map, cut out Chile (which ranks number 38, so it does not seem to be very large) and place it over Europe: one end is on the north of Sweden and the other end reaches… the Sahara desert!
It goes without saying that size does not matter, though.
According to the WHO, every year 388,000 people drown in the world, including 175,000 children. Drowning outcomes mean those deaths caused by respiratory impairment from submersion/immersion in liquid, be it in the sea, in a river, in a swimming-pool or any other natural or artificial pool. As usual for high figures when counting people, money or stars, it is difficult to really understand what it stands for and it is necessary to compare it with other figures to have a clear idea of its magnitude. Let’s see an example: every year, the number of people drowned doubles the number of casualties in war (172,000 people).
In most countries including Spain, drowning is the third leading cause of accidental death and the first in children under 5 years of age. For the moment, car accidents are still the first cause of mortality: 2,560 people were dead in road accidents in Spain in 2008, whereas 2,052 drowned. However, road safety campaigns are effective and statistics can be different: in 2003, the number of people dead in road accidents (5,478) was five times greater than in 2008 in Spain. At this rate, we could get similar figures than in the Spanish region of Galicia, where drowning has become the first cause of mortality by accident.
In order to account for such dropping figures, it is said that car accidents can be prevented, whereas drowning cannot because it is a natural, unavoidable phenomenon. However, statistics reveal that this argument does not add up: any person living in low- or middle-income countries has six times more chances to drown than any other person living in a high-income nation. Maybe drowning is not so natural...
Although in 2009 the number of tourists visiting Spain dropped 8.7% in relation to the previous year due to the financial crises, figures are still very high: in 2009, Spain received 52.5 million tourists. And this is even more amazing if compared to Spanish demographics: in 2009, Spain had 45,989,016 inhabitants. The UNWTO (United Nations World Tourism Organization), a Madrid-based agency depending on the UN devoted to promoting tourism and drawing statistics, ranks Spain as the third most visited country in the world, just after France (74 million tourists) and the US (55 million tourists). The list goes on with China, Italy, United Kingdom, Turkey, Germany, Malaysia and Mexico, leading the ranking of the world’s ten major tourism destinations. Useful as this kind of reports may be as a source of tourism know-how, they only take into account the financial impact of tourism, leaving aside the social, cultural or ecological impact of the fact that, every year, one out of every 8 citizens in the world, that is, 880 million people decide to travel for sightseeing to another country.


